Site blog
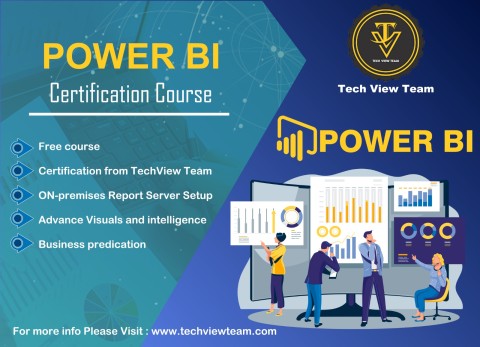
Welcome to the TechViewTeam blog! We are excited to introduce our comprehensive course, Power BI Mastery. This course is designed to empower you with the skills needed to harness the full potential of Power BI, a leading business analytics tool by Microsoft. Whether you're a data enthusiast, an analyst, or a business professional, our Power BI Mastery course will equip you with the knowledge and tools to transform your data into actionable insights.

Why Power BI?
Power BI is a powerful tool that allows users to connect to a wide range of data sources, transform raw data into meaningful visuals, and share insights across an organization. Here are a few reasons why mastering Power BI is essential:
- Data Visualization: Create stunning, interactive visualizations that make complex data easier to understand.
- Data Integration: Connect to various data sources including Excel, databases, cloud services, and more.
- Ease of Use: With its intuitive interface, Power BI is accessible to users at all skill levels.
- Collaboration: Share insights and collaborate with your team in real-time, making decision-making more efficient.
- Scalability: Power BI scales with your data, handling small projects to enterprise-level datasets seamlessly.
Course Overview
Our Power BI Mastery course is structured to take you from beginner to expert. Here’s a sneak peek into what you can expect:
Module 1: Introduction to Power BI
- Understanding the Power BI Ecosystem: Learn about the different components of Power BI including Power BI Desktop, Service, and Mobile Apps.
- Getting Started: Step-by-step guide to setting up Power BI, connecting to data sources, and creating your first report.
Module 2: Data Preparation
- Data Import Techniques: Import data from various sources like Excel, SQL Server, and web data.
- Data Transformation with Power Query: Clean and transform your data using Power Query Editor.
Module 3: Data Modeling
- Building Data Models: Create relationships between different data tables and build robust data models.
- DAX Fundamentals: Introduction to Data Analysis Expressions (DAX) for creating calculated columns and measures.
Module 4: Data Visualization
- Creating Visuals: Learn to create a variety of visuals including charts, maps, and tables.
- Advanced Visualization Techniques: Use custom visuals, slicers, and filters to enhance your reports.
Module 5: Sharing and Collaboration
- Publishing Reports: Share your reports and dashboards with stakeholders.
- Power BI Service: Explore collaborative features and manage report distribution.
Module 6: Advanced Analytics
- Using R and Python in Power BI: Integrate R and Python scripts for advanced analytics.
- AI Features: Utilize Power BI’s AI capabilities like Q&A and Quick Insights.
Benefits of Enrolling
Expert Instructors
Learn from seasoned professionals with extensive industry experience. Our instructors bring real-world knowledge to the classroom, ensuring you gain practical skills that you can apply immediately.
Hands-On Learning
Our course emphasizes practical, hands-on learning. You’ll work on real-world projects, applying what you learn to create meaningful Power BI reports and dashboards.
Community Support
Join a community of like-minded learners and professionals. Collaborate, share insights, and get support from peers and instructors through our online forums and live sessions.
Certification
Upon completion of the course, you’ll receive a certification that validates your Power BI skills and enhances your professional credentials.
Enroll Now
Don’t miss the opportunity to elevate your data analytics skills with Power BI. Enroll in our Power BI Mastery course today and start transforming your data into powerful insights.
Stay tuned to the TechViewTeam blog for more updates, tips, and resources on Power BI and other cutting-edge technologies. Happy learning!
Indian Webs Indian Webs Sunil Dutt, Founder, TechView Team